

Abstract:
The Sigma Metric is a crucial tool for evaluating laboratory quality control (QC) performance, providing a standardised measure of analytical process capability. This manuscript presents a comparative analysis of sigma values for routine chemistry parameters (29 analytes) between January and July at our laboratory using two levels of controls. The objective was to assess changes in analytical performance over a six-month period. Data were analysed from January and June, followed by July, with sigma values calculated based on internal QC and proficiency testing data. The findings clearly highlight the laboratory’s strong analytical capability, with the majority of analytes (25 analytes) achieving Six-Sigma performance — reflecting excellent precision, accuracy, and process stability. A few parameters (4 analytes) showed sigma values in the 3–5 range, which served as constructive indicators for fine-tuning existing processes. We took additional measures for these selected parameters by consistently following maintenance guidelines and improving QC storage and water quality, which led to an upward trend in sigma values for these analytes in July. These findings underscore the dynamic nature of laboratory performance and the importance of maintaining high-quality patient care.
Key words: Six-Sigma, Quality Controls, Quality Performance, TIQCon.
Introduction
Quality control (QC) is an essential component of clinical laboratory operations, ensuring the accuracy and reliability of patient test results.1 The Sigma Metric provides a quantitative framework for assessing the effectiveness of a QC system by relating the analytical process to its defined quality requirements. A higher sigma value indicates a more capable and robust process, with a widely accepted benchmark of Six-sigma representing world-class performance.2 By analysing changes in the sigma Metric over time, laboratories can identify trends, troubleshoot issues, and implement corrective actions to improve analytical quality.3 This study aims to compare the sigma values of common analytes at distinct time points — January and June, followed by July — to evaluate changes in analytical performance over a six-month period using two levels of controls.
Methods
The dataset for this analysis consisted of sigma values for all 29 analytes, collected from Precicontrol Clinical Chemistry (PCCC1 and PCCC2) controls running on Cobas Pro (Roche) at our laboratory (Max Lab). Data 06 The Max Medical Journal March 2026 was provided for two time points: January and June, followed by July after taking necessary measures. The sigma values were calculated using TIQCon Quality Performance (TIQCon QP) software,4 which applies the standard formula:
σ = (TEa – Bias%)/CV%
Where: TEa = Total allowable error (from Clinical Laboratory Improvement Amendments [CLIA], European Federation of Clinical Chemistry and Laboratory Medicine [EFLM], National Accreditation Board for Testing and Calibration Laboratories [NABL], etc.) Bias = Difference between lab mean and target mean (%) CV = Coefficient of variation (%) For this study, the sigma values were treated as the primary data points for comparison. A simple descriptive statistical analysis was performed to identify the change in sigma values for each analyte between January and June, followed by July. An increase in the Sigma value was considered an improvement in performance.
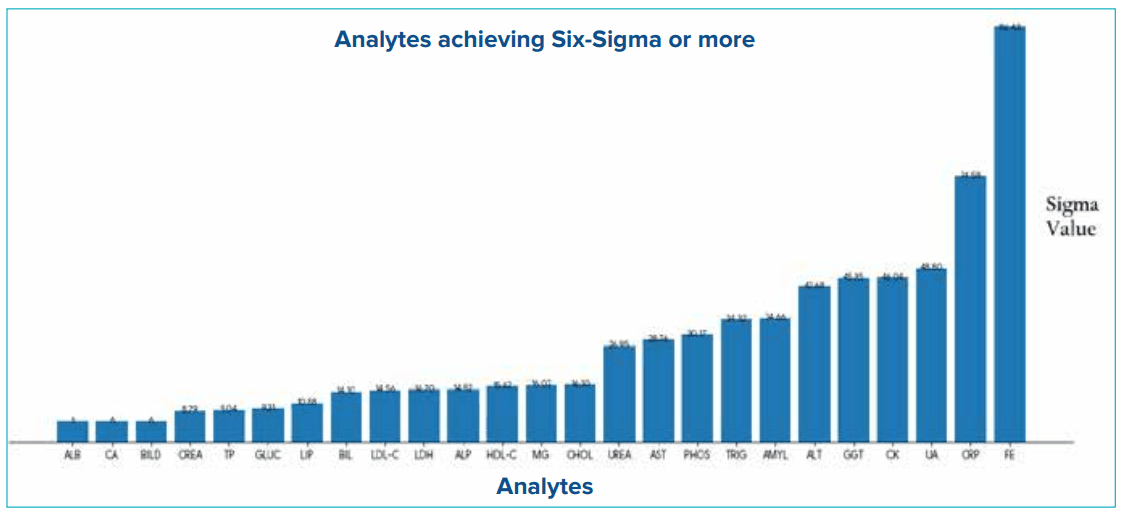
Figure 1: Analytes achieving Six-sigma or more.
Abbreviations: ALB: Albumin; ALP: Alkaline Phosphatase; ALT: Alanine Aminotransferase; AMYL: Amylase; AST: Aspartate Transferase; BIL: Bilirubin; BILD: Direct Bilirubin; CA: Calcium; CHOL: Cholesterol; CK: Creatine Kinase; CREA: Creatinine; CRP: C-Reactive Protein; FE: Iron; GGT: Gamma-Glutamyl Transferase; GLUC: Glucose; HDL-C: High-Density Lipoprotein Cholesterol; LDH: Lactate Dehydrogenase; LDL-C: Low-Density Lipoprotein Cholesterol; LIP: Lipase; MG: Magnesium; PHOS: Phosphorus; TP: Total Protein; TRIG: Triglycerides; UA: Uric Acid; UREA: Urea.
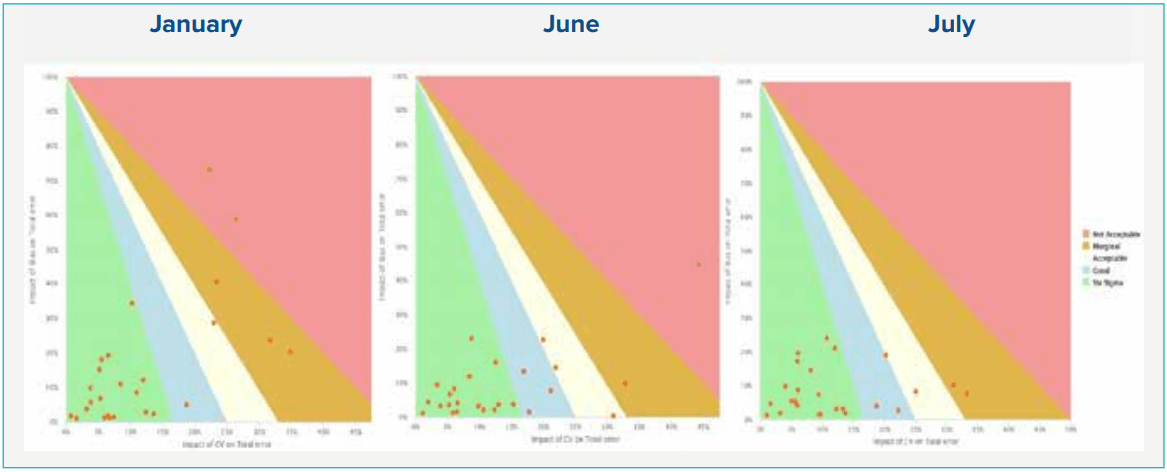
Figure 2: Sigma Matrix (Operational performance specifications [OPS] chart) of all the analytes across the months using PreciControl Clinical Chemistry (PCCC1) in Cobas Pro with TIQCon Quality Performance software.5
Abbreviations: CV: Coefficient of Variation.
While most analytes demonstrated strong and stable performance — particularly enzymatic and endpoint assays such as alanine aminotransferase (ALT) and aspartate aminotransferase (AST) — reaching and sustaining Six-Sigma capability, a few parameters reflected sigma values in the 3–5 range. Rather than indicating concern, these findings highlight valuable opportunities for further optimisation. Electrolytes such as chloride, sodium, and magnesium remained only marginally below the Six-Sigma threshold, suggesting that with minor refinements — such as focused maintenance, verification of QC storage practices, and routine lot assessment — their sigma performance can be enhanced. This positive trend underscores the system’s robustness and shows that continuous quality improvement measures are already guiding these analytes toward Six-Sigma capability. These focused actions led to measurable improvement in sigma values for these analytes, as demonstrated in Figures 1, 2 and 3. This positive trend underscores the system’s robustness and reflects the effectiveness of ongoing quality improvement efforts.
Figure 3: Sigma Matrix (Operational performance specifications [OPS] chart) of all the analytes across the months using PreciControl Clinical Chemistry (PCCC2) in Cobas Pro with TIQCon Quality Performance software.5
Abbreviations: CV: Coefficient of Variation.
Discussion
The overall Six-Sigma assessment demonstrates that the majority of analytes are performing exceptionally well within desirable quality specifications, with several achieving Six-Sigma capability — an indicator of strong analytical robustness and effective quality management. This consistent performance affirms that the laboratory’s calibration practices, reagent management, and QC procedures are operating at an optimal and stable level.6 The few analytes reflecting sigma values in the 3–5 sigma range should be viewed positively, as they highlight natural operational variability and offer meaningful opportunities for refinement.7 Importantly, the notable improvements observed in parameters such as chloride, sodium, and magnesium reflect the effectiveness of timely interventions, including proactive maintenance, calibration, reagent lot verification, and optimisation of QC storage and maintenance workflows. These actions successfully improved precision, reinforcing the system’s capability for rapid performance recovery. Operational factors — such as reagent lot transitions, scheduled maintenance activities, and environmental or storage conditions — can influence sigma values, and addressing them through routine preventive maintenance and strengthened QC handling ensures sustained high-quality output. Overall, this assessment validates the strong analytical performance of the Roche Cobas Pro platform while also demonstrating the laboratory’s commitment to continuous improvement. Although based on a short evaluation period, the trends provide valuable insights and clearly support ongoing strategies for maintaining and further enhancing Six-sigma-level capability.
Declaration of conflicting interests:
The author(s) declare no potential conflicts of interest with respect to the research, authorship, and/or publication of this article. Author(s) also declare no use of artificial intelligence (AI) in generating images and writing the article.
Conclusion:
The comparative analysis of sigma values from January to July highlights the strength of Six-Sigma as a proactive and dynamic tool for monitoring analytical performance. It is encouraging that most analytes consistently achieved sigma values within the desirable Six-Sigma range, reaffirming the laboratory’s strong analytical capability. In July, the impact of focused quality interventions — such as scheduled maintenance, optimised QC storage, and seamless lot-to-lot verification — resulted in a clear upward shift in sigma performance. Although the data are based on a limited evaluation duration, the positive trends clearly illustrate the laboratory’s commitment to quality excellence and further strengthen overall patient safety.
Mohini Bhargava, Prabhat Maurya. Analysis of Laboratory Quality Control Performance: A Six-Month SixSigma Metric Study. MMJ. 2026, March. Vol 3 (1).
Report. MMJ. 2024, December. Vol 1 (4).
References
- Kumar BV, Mohan T. Sigma metrics as a tool for evaluating the performance of internal quality control in a clinical chemistry laboratory. J Lab Physicians. 2018;10(2):194–9.
- Adiga US, Preethika A, Swathi K. Sigma metrics in clinical chemistry laboratory-A guide to quality control. Al Ameen J Med Sci. 2015;8(4):281–7.
- Afrifa J, Gyekye SA, Owiredu WK, et al. Application of sigma metrics for the assessment of quality control in clinical chemistry laboratory in Ghana: A pilot study. Niger Med J. 2015;56(1):54–8.
- Metsu D, Mille D, Pailly C, et al. Analytical assays and bootstrap resampling method to validate performance of the Roche Elecsys STAT highly sensitive troponin T assay and its application for the ‘rule-out’ part of ESC guidelines for NTSTEMI. Ann Clin Biochem. 2024;61(1):63–9.
- TIQCon Quality Performance software. Available at: https:// www.tiqcon.com. Accessed on: 11th November 2025.
- Gülbahar Ö, Kocabıyık M, Çıracı M Z, et al. The use of six sigma methodology to evaluate the analytical performances of clinical chemistry analyzers. Turk J Biochem. 2018;43(1):1–8.
- Ilardo C, Lamarti C, Al Muhanna B. Sentinel testing, analytical sigma metrics and a risk management approach as part of a simplified method verification/validation process. Scand J Clin Lab Invest. 2024;84(7-8):569–76.